
This week’s theme is inspired by a recent family holiday to Norfolk, where I spent most of my time staring out to sea and shouting “there’s one!” every time a seal poked their head above the water. It was the first time I’ve seen seals in the wild and it was a joy to see them bobbing away in the North Sea.

The Viz
I wanted to use one of Tableau’s in built maps to show the top places to see seals in the UK, but also add in some additional facts about the beautiful creatures. I decided to use the satellite map in Tableau as I love using maps as backgrounds and I plotted the lat/long data for the top 10 places to seal watch according to Countryfile.
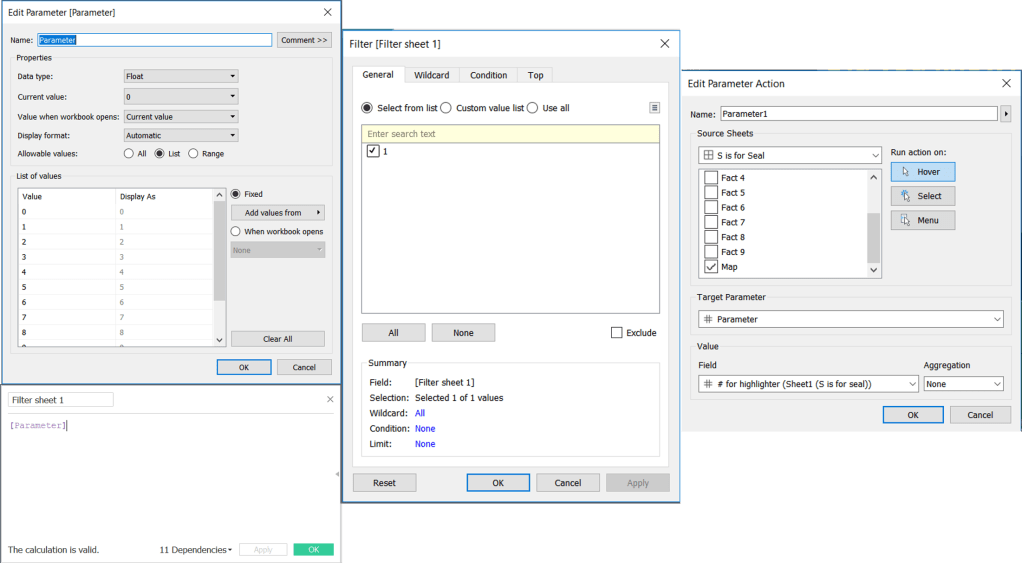
Next up, I designed a pop up box that includes a fact about seals. Using parameter actions, I could make these pop up depending on where a user hovered, so once I’d added the text, I added in a parameter with values 0-10 and created a calculation to bring in the parameter value. I then used that as a filter on the fact sheet and duplicated this to create 10 different facts. Finally, I added a parameter action using the map to update the parameter value depending on which site a user hovered over.
And that’s pretty much it! It’s nothing fancy because I had a hectic week catching up after a holiday, but I’m pleased I got to play with the parameter actions again.
What’s Next?
Next week it’s over to Adam and we’re up to T! I can’t believe how quickly we’re flying through the alphabet, so be sure you don’t miss Adam’s viz by keeping an eye on his Tableau Public profile and his blog.
