
Music has always been a huge part of my life. I’m not ashamed to say that my first album was The Smurfs Go Pop, which I played it ’til the tape snapped; I can still remember all of the dance moves to One For Sorrow after spending my pocket money on the CD single; and when my husband and I got married, we didn’t exchange wedding rings, we exchanged the tickets from the gig where we met (Reel Big Fish at Rock City in Nottingham if anyone is interested). So it’s safe to say that when Adam Green (@greenynorfolk) picked “Artists” for our first #AlphabetProject vizzes, I was as pleased as punch. And I was so proud to see his viz be awarded #VOTD last week.

My Viz
Like Adam, I wanted to focus on Artists in the UK charts, but I looked at those with number one singles. Unsurprisingly, The King topped the list for number of Number One Singles and total weeks holding the Number One spot.
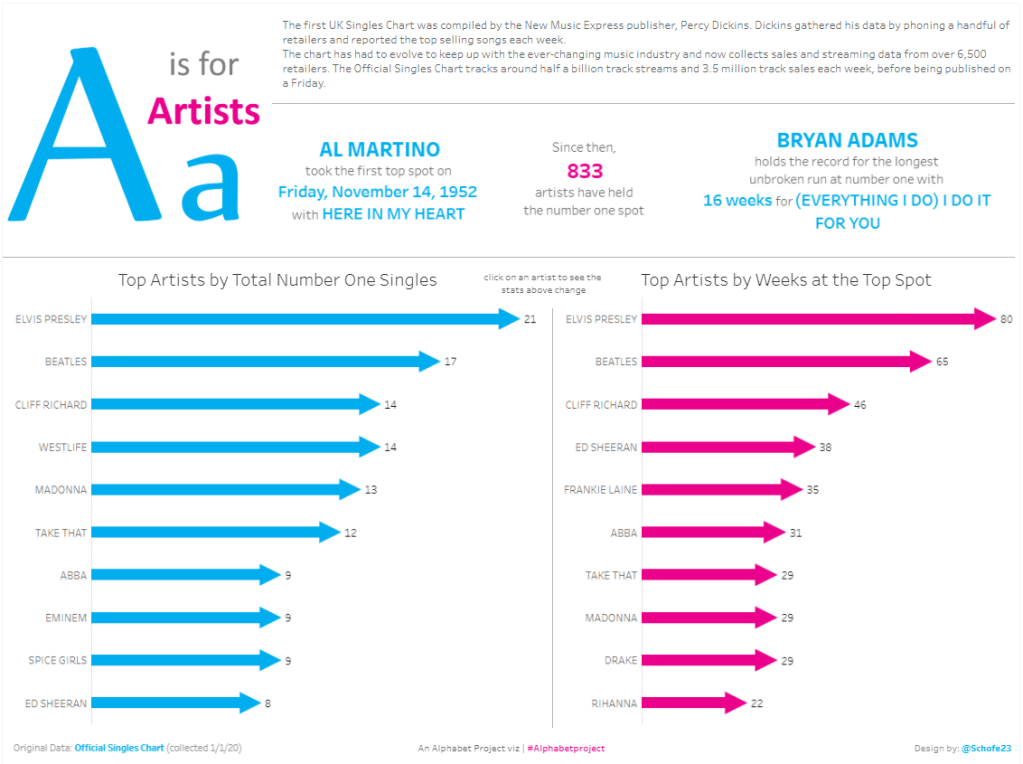
I got the data from Official Charts and after a little manual cleaning, started to investigate the data. I was surprised to realise that I had no idea who took the first Number One spot, so I wanted to highlight Al Martino’s achievement with a couple of other stats in my BANner (big ass number banner) and a blurb about how the chart came to be what we know and love today.
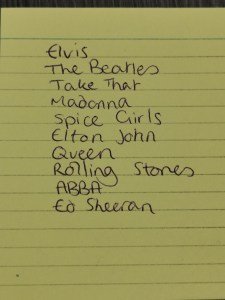
Then on to the top 10s…my husband and I love a quiz, so we both had a go at guessing the top 10 artists by number of Number One singles. I managed to guess a few, but you can see from my list that I was way off with some of my guesses!
When I put us out of our misery and built the bar chart, I decided to use the colours and arrows from the Official Charts logo to throw a call out to them. I built out my second bar chart and used a highlight action across the two. I also built up two viz in tool tips to show the detail behind each bar.
At the request of the other half, I then used set actions (which are quickly becoming one of my favourite features in Tableau) to update the BANner to give key facts about a selected artist.
I had a lot of fun with this dataset, so I hope you enjoy looking at my viz.
What’s next?
Adam and I have quite a few things in common:
- We’re both northern souls living a southern life
- We both love animals and have a fair few pets between us
- Neither of us chose a degree that would suggest a life in data was ahead
But perhaps my favourite commonality is our love of beer. So…
I’ve previously mentioned that I love Adam’s Iron Viz entry about beer, so I’m excited to see what else he can come up with on the subject!
Over to you Adam…
